
December 22, 2025
- Real Estate Tech
- AI Technology
- 3D Visualization
- Design Visualization
Cut 3 Weeks from Real Estate Sales Cycle: The ROI of AI 2D to 3D Visualization
Hemanth Velury
CEO & Co-FounderThe ROI of Faster Feedback Loops: How Real Estate Teams Cut 3 Weeks from Sales Cycle with AI Visualization
Real estate runs on time. Every week a property sits unshown is revenue delayed. Every round of client revisions extends the timeline. Every communication gap between designer, builder, and buyer adds friction.
Traditionally, visualization was a bottleneck in this process. You'd invest weeks in professional renderings to pre-sell a development. Buyers would struggle to visualize a concept from a 2D floor plan. Developers would fund multiple revision rounds because stakeholders couldn't align on the design. By the time everyone agreed on what they were building, weeks had evaporated.
Then came AI-powered floor plan to 3D visualization and virtual staging. Suddenly, what took weeks happens in hours. And that speed difference isn't just convenient — it's transforming the economics of real estate development and sales.
The ROI is measurable, dramatic, and multi-dimensional. Let's break it down.
The Old Sales Cycle: Weeks of Waiting
Here's what a traditional pre-sales cycle looked like for a residential development:
- Week 1-2: Developer hires visualization firm, briefs them on the project. Visualization team gathers 2D plans, unit types, design intent.
- Week 2-3: Visualization team creates 3D models. This means CAD specialists rebuilding the architectural plans in 3D software, material artists applying finishes, lighting engineers setting up illumination. For a multi-unit building with several unit variants, this could mean dozens of 3D models.
- Week 3-4: First render passes come back. Developer, architect, and sales team review. Inevitably: "The color palette is too warm"; "Make the sofa larger"; "Show the view from the balcony"; "Can we see the kitchen differently?"
- Week 4-5: Revision round. Visualization firm implements changes. More time in render queue.
- Week 5-6: Revised renders approved. Now they go to marketing for photo editing, website integration, brochure design. Sales team finally has marketing collateral.
- Week 6-8: Sales begins. But here's the thing: By the time the imagery is ready, some of the market window has closed. Early-adopter buyers who were interested 3-4 weeks ago have moved on or made decisions based on incomplete information.
Total timeline: 6-8 weeks from project brief to market-ready visualization. For a 300-unit residential tower, this is weeks of lost sales opportunity.
The New Sales Cycle: Hours of Iteration
Now let's look at the same project with AI-powered floor plan to 3D visualization:
- Hour 1: Sales team uploads 2D floor plans to the visualization platform. Selects "Modern Luxury" style. Platform generates dozens of styled unit variations in 90 seconds each.
- Hour 2: Review the initial renders. Decide to test "Contemporary Minimalist" style as an alternative.
- Hour 3: New style variations generated and reviewed. Marketing team selects top 10 images.
- Hour 4: Additional variations (different furniture arrangements, alternate color schemes) generated for marketing A/B testing.
- Hour 5: Marketing has 40+ high-quality, stylistically coherent images ready for website, brochures, social media. Sales begins immediately.
Total timeline: 5 hours from project brief to market-ready visualization.
That's a 96-hour compression. 6-8 weeks becomes 5 hours.
Breaking Down the ROI
The business impact of that compression is significant across multiple dimensions:
Time-to-Revenue Compression
A 300-unit residential project priced at an average $800K per unit = $240M total revenue.
In a market where strong early interest typically converts 30-40% of viewers to buyers, accelerating the visualization timeline by 6 weeks can mean capturing dozens of additional early-bird purchases that might otherwise go to competitors.
Conservative estimate: 5-10 additional units sold per week of acceleration = 30-60 additional units sold = $24-48M incremental revenue by moving market entry up 6 weeks.
Even accounting for volume discounts or promotional pricing, that's tens of millions of dollars in accelerated cash flow.
Reduced Revision Cycles
Traditional visualization involved 2-3 revision rounds. Each revision took 3-5 days.
With instant 2D to 3D visualization, revisions happen in real-time. Stakeholders can explore variations without specialist middlemen. Instead of "please make the couch bigger" requiring a re-render cycle, it's done instantly.
A typical project with 3 formal revision rounds at 3-5 days each = 10-15 days of waiting. With AI visualization, those 3 revision rounds happen in parallel, in hours.
Savings: 10-15 days per project. For a development company doing 5-10 projects per year, that's 50-150 days of accelerated timelines.
In real terms: a project that would have taken 12 weeks takes 10 weeks. That's 2 weeks of earlier market entry, earlier buyer engagement, earlier cash collection.
Lower Visualization Costs
Professional visualization for a residential project typically costs $15K-$50K depending on complexity and number of variants.
AI-powered floor plan to 3D platforms typically cost $500-$2,000 for a comparable set of renders and variations or can be accessed via subscription models at $200-$500/month.
Savings per project: $12,500-$49,500.
For a development company doing 5-10 projects per year, that's $62,500-$495,000 in annual visualization savings. That money gets redirected to marketing, early incentives, or bottom-line profit.
Buyer Engagement and Conversion Improvement
Here's where the ROI becomes qualitative but powerful: AI-generated 3D visualization isn't just faster: It's often better at engaging buyers.
Staged homes sell 73% faster than non-staged homes. AI virtual staging brings professional staging to every listing.
A real estate study found that properties with high-quality, staged imagery receive up to 118% more online views than vacant or empty properties.
For pre-sales marketing, this translates to:
- Higher inquiry rates (more views → more inquiries)
- Higher tour scheduling rates (better imagery drives qualified interest)
- Higher conversion rates to purchase (buyers who can visualize the space emotionally connect to it faster)
A conservative estimate: AI virtual staging and photorealistic 2D to 3D visualization could improve buyer inquiry rates by 30-50% and conversion rates by 15-25%.
For a 300-unit project:
- Baseline conversion: 40% of total addressable market (TAM) = 120 units sold
- With improved visualization: 50-60% of TAM = 150-180 units sold
- Incremental revenue: 30-60 units @ $800K = $24-48M
Options Exploration and Optionality Value
Because AI visualization is so cheap and fast, teams can explore vastly more design options. Instead of picking one color palette and one furniture scheme, you can show buyers 5-10 variations and let them choose. This optionality has real value: Buyers feel empowered, less second-guessing, stronger ownership of the decision. Psychologically, when a buyer has chosen a specific variant (rather than being shown one pre-decided look), they're more committed and less likely to back out. This doesn't have a direct dollar figure, but it improves hold rates and reduces post-purchase regret and cancellations.
Real-World Metrics: What Companies Are Actually Seeing
Let's ground this in concrete examples:
Example 1: Luxury Residential Developer
A luxury residential developer typically handles 3-5 projects per year. Each project involves 200-500 units with 8-12 distinct floor plan types.
Before AI visualization: Each project took 8-10 weeks to get market-ready imagery. Revision cycles were a constant drag. Visualization costs ran $30-50K per project.
After implementing instant 2D to 3D visualization:
- Project timeline compressed from 10 weeks to 6 weeks (40% reduction)
- Visualization costs dropped from $40K to $1.5K per project
- Revision cycles compressed from 10-15 days to 1-2 days
- Pre-sales inquiry rates increased 35% (directly attributed to better imagery and faster market entry)
- Overall revenue velocity increased by an estimated 15% (combination of faster sales cycle + higher inquiry rates + better conversion)
For a typical $200M project, a 15% velocity improvement = $30M of accelerated or incremental revenue.
Example 2: Mid-Market Real Estate Firm
A mid-market real estate brokerage typically handles 50-100 residential listings per year.
Before AI virtual staging: Most listings were empty homes. Professional staging was reserved for top-tier properties. Photography was static — one angle, one shot per room.
After implementing AI virtual staging:
- Virtual staging applied to 80% of listings (vs. 10% previously)
- Photography expanded to show multiple style variations
- Average days-on-market decreased from 35 days to 24 days (31% faster sale)
- Average sale price increased 5-8% (better staged imagery attracted more serious buyers)
- Commission income increased 8-12% (faster sales with higher prices)
For a typical brokerage doing $50M in annual sales volume, a 10% improvement in average sale price = $5M incremental revenue. A 31% reduction in days-on-market = freed inventory faster, allowing agents to list and sell more homes per year (20% more throughput) = additional $10M in sales volume.
The Math: Total ROI Calculation
Let's model a realistic scenario for a mid-sized development company doing 5 projects per year:
- 5 projects per year, 200 units per project = 1,000 units/year
- Average unit price: $800K
- Total addressable revenue: $800M annually
Baseline Metrics (without AI visualization)
- Time to market: 10 weeks per project
- Visualization cost: $40K per project = $200K annually
- Pre-sales conversion rate: 40% = 400 units sold
- Average conversion timeline: 8 weeks from marketing launch to sale
After AI Visualization
- Time to market: 6 weeks per project (4-week acceleration)
- Visualization cost: $1.5K per project = $7.5K annually
- Pre-sales conversion rate: 50% = 500 units sold
- Average conversion timeline: 6 weeks from marketing launch to sale
ROI Calculation
Direct Savings
Visualization costs reduced: $200K - $7.5K = $192.5K annual savings
Accelerated Revenue (4-week acceleration for 5 projects)
- 4 weeks earlier market entry means earlier capture of demand
- Conservative: 10 units per week sold earlier, 4 weeks, 5 projects = 200 units sold earlier
- 200 units @ $800K = $160M accelerated revenue
Improved Conversion
100 additional units sold (10% improvement in conversion) @ $800K = $80M incremental revenue
Total Annual ROI
- Direct savings: $192.5K
- Accelerated revenue: $160M (one-time, in year 1)
- Incremental annual revenue: $80M (recurring)
Year 1 Total: $160M accelerated + $192.5K saved = $160M+ value creation
Year 2+: $80M+ incremental annual revenue
Even with conservative assumptions (10% conversion improvement, 4-week acceleration), the ROI is massive.
Why This Works: Feedback Loop Velocity
The core insight: the real estate sales cycle is driven by feedback loop velocity. Faster feedback loops = faster decisions = faster sales. Traditional visualization kept feedback loops slow. A buyer had to imagine a space from a 2D plan. They had to communicate vague feedback ("I don't like the layout"). That feedback had to be manually implemented into a new render. Days passed. Momentum died.
AI-powered 2D to 3D visualization accelerates feedback loops dramatically. A buyer can see the space instantly. They can compare variations in real-time. Decisions happen faster. Sales accelerate. And because the tool is cheap and fast, teams can be more experimental — testing multiple styles, layouts, marketing messages. The best-performing variant gets prioritized. This A/B testing at scale improves overall conversion rates.
Conclusion: Faster Feedback, Better Business
The ROI of AI visualization in real estate isn't speculative. It's happening right now. Development companies, brokerages, and architects are seeing measurable improvements in:
- Time-to-revenue compression
- Visualization cost reduction
- Buyer engagement and conversion improvement
- Design exploration and optionality
- Project profitability
The 3-week compression cited in the title is conservative. Some teams are seeing 4-6 weeks of acceleration. The ripple effects across sales velocity, buyer confidence, and marketing effectiveness compound the benefit.
In real estate, time is money. AI visualization gives you time back. And what you do with that time — faster market entry, more design options, better buyer engagement — determines your competitive advantage.
Note: While the currency is in USD, because data is more easily available from the US — the data is comparable for other markets.
Recommended for you

July 29, 2026
Kitchen and Bath: The Two Rooms That Decide Resale | VirtualSpaces
HHemanth Velury
CEO & Co-Founder
July 27, 2026
Why Empty Rooms Don't Sell: Virtual Staging | VirtualSpaces
HHemanth Velury
CEO & Co-Founder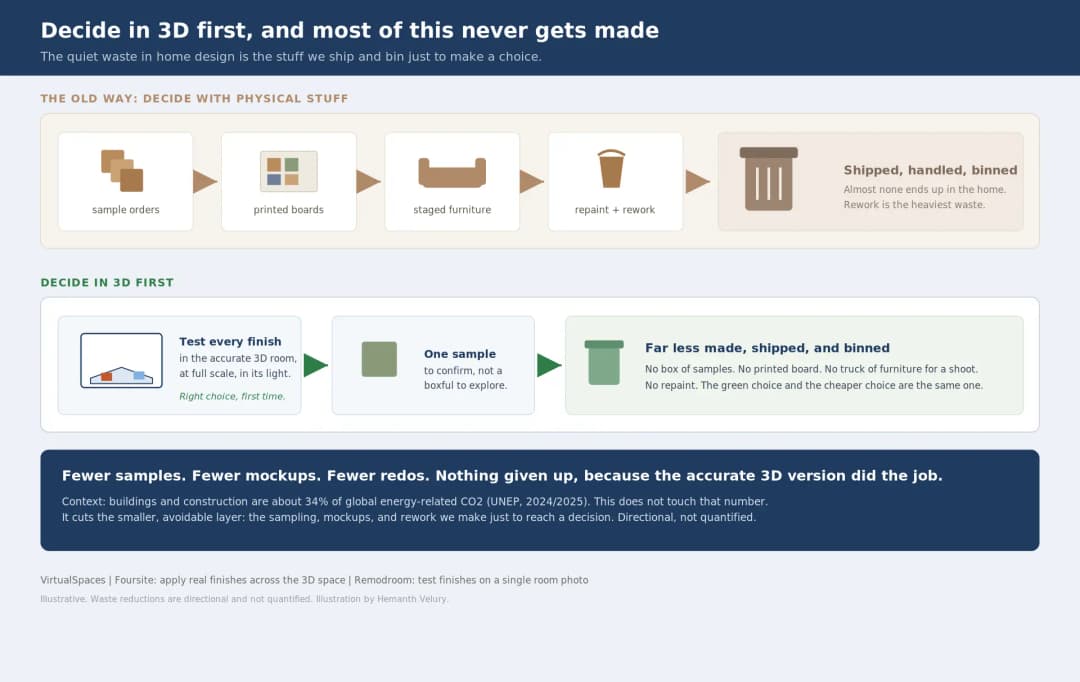
July 24, 2026
The Quiet Sustainability Win of Deciding in 3D | VirtualSpaces
HHemanth Velury
CEO & Co-Founder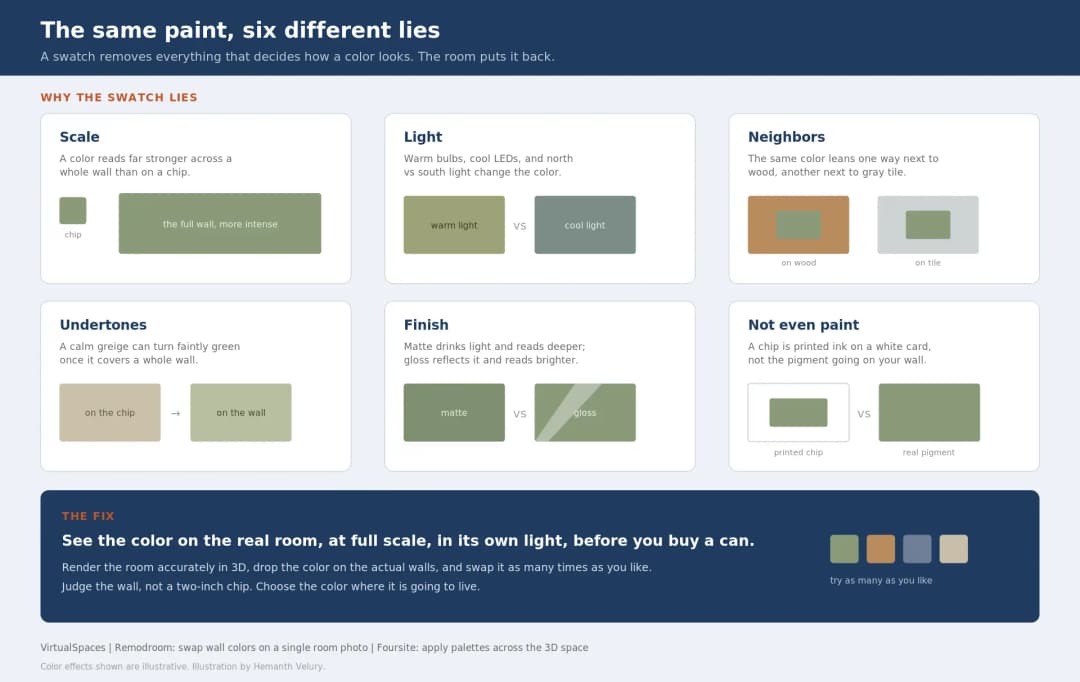
July 22, 2026
Why Paint Swatches Lie: Test Color in 3D First | VirtualSpaces
HHemanth Velury
CEO & Co-Founder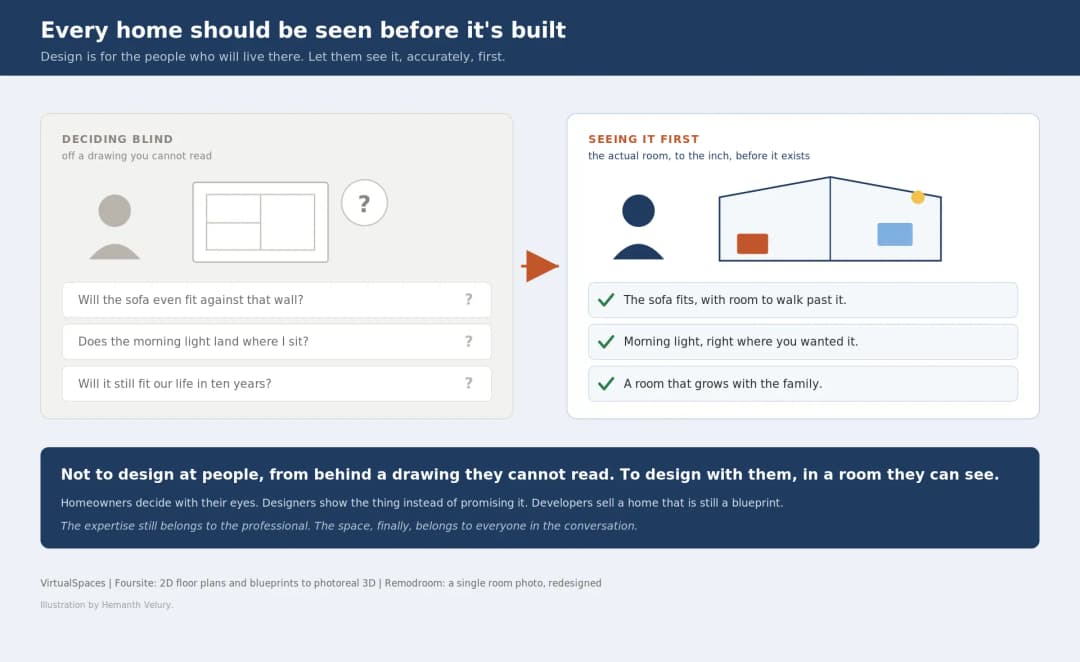
July 20, 2026
Why Every Home Should Be Seen Before It's Built | VirtualSpaces
HHemanth Velury
CEO & Co-Founder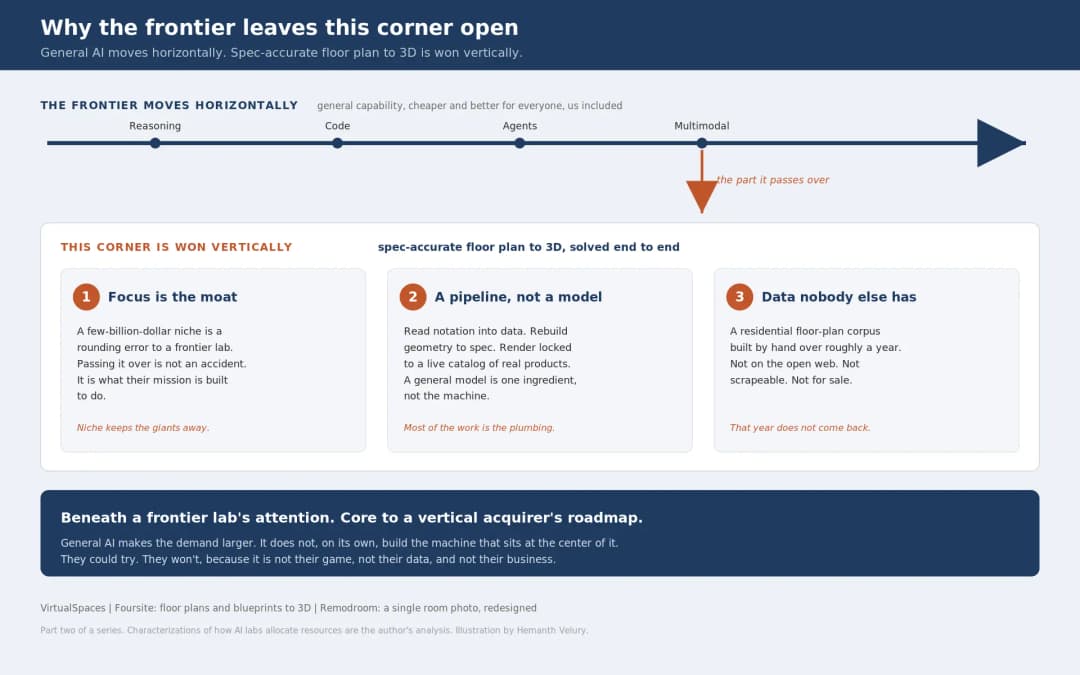
July 17, 2026
Why Big AI Labs Won't Build Floor Plan to 3D | VirtualSpaces
HHemanth Velury
CEO & Co-Founder
July 15, 2026
How We Solve Floor Plan to 3D, Accurately | VirtualSpaces
HHemanth Velury
CEO & Co-Founder
July 13, 2026
Designing Homes That Age With the People in Them | VirtualSpaces
HHemanth Velury
CEO & Co-Founder
July 10, 2026
Designing Spaces for How Light Actually Moves | VirtualSpaces
HHemanth Velury
CEO & Co-Founder
July 08, 2026
Designing Homes for Every Life Stage in 3D | VirtualSpaces
HHemanth Velury
CEO & Co-Founder
July 06, 2026
Build an Interior Design Portfolio Without Clients | VirtualSpaces
HHemanth Velury
CEO & Co-Founder
June 26, 2026
AI Interior Design: Full 3D Workflow in One Platform | VirtualSpaces
HHemanth Velury
CEO & Co-Founder
June 24, 2026
Scope Creep in Interior Design: How AI Visualization Fixes It | VirtualSpaces
HHemanth Velury
CEO & Co-Founder
June 22, 2026
What Buyers See on a Floor Plan: Your Biggest Sales Problem | VirtualSpaces
HHemanth Velury
CEO & Co-Founder
June 19, 2026
Small Design Studios vs Big Firms: The AI Advantage | VirtualSpaces
HHemanth Velury
CEO & Co-Founder
June 17, 2026
After the Mood Board: AI Interior Visualization | VirtualSpaces
HHemanth Velury
CEO & Co-Founder
June 15, 2026
Foursite Pro Editor: Full Floor Plan Control for Designers | VirtualSpaces
HHemanth Velury
CEO & Co-Founder
June 12, 2026
AI Interior Design: Style Any Room in Seconds with Foursite | VirtualSpaces
HHemanth Velury
CEO & Co-Founder
June 10, 2026
Foursite: Floor Plan to 3D Walkthrough in Minutes | VirtualSpaces
HHemanth Velury
CEO & Co-Founder
June 08, 2026
Win More Pitches With AI Renders Before the Meeting | VirtualSpaces
HHemanth Velury
CEO & Co-Founder
June 05, 2026
From Floor Plan to Finished Room: What AI Now Makes Possible | VirtualSpaces
HHemanth Velury
CEO & Co-Founder
June 03, 2026
The Interior Design Brief Is Broken. AI Fixes It | VirtualSpaces
HHemanth Velury
CEO & Co-Founder
June 01, 2026
Pre-Construction Home Sales: AI Interior Visualization Guide | VirtualSpaces
HHemanth Velury
CEO & Co-Founder
May 30, 2026
Interior Design Principles: Applied with AI | VirtualSpaces
HHemanth Velury
CEO & Co-Founder
May 28, 2026
Designing Spaces for People, Not Blueprints | VirtualSpaces
HHemanth Velury
CEO & Co-Founder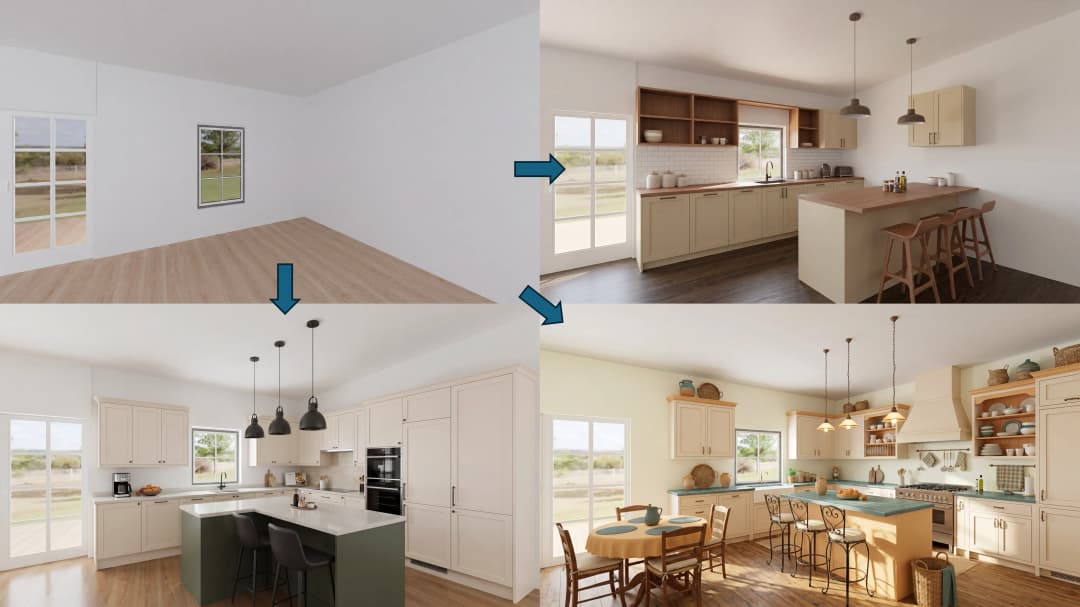
May 26, 2026
The Future of Interior Design: Closing the Visualization Gap with Foursite and Remodroom | VirtualSpaces
HHemanth Velury
CEO & Co-Founder
May 18, 2026
How AI Visualization Upgrades Property Data Platforms | VirtualSpaces
HHemanth Velury
CEO & Co-Founder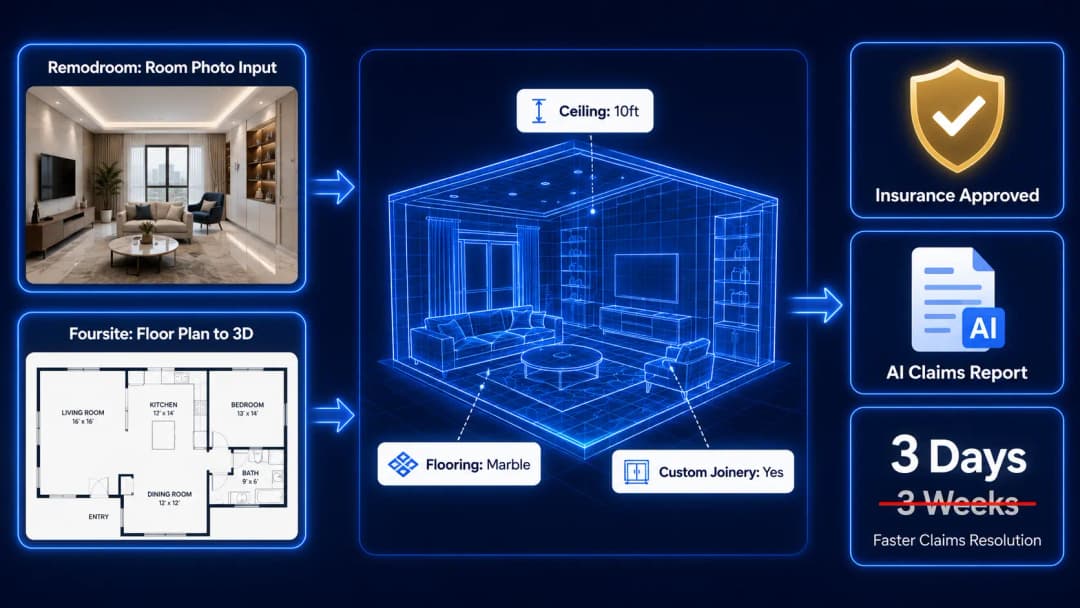
May 14, 2026
How AI-First Insurers Can Use 3D Property Data to Transform Home Claims | VirtualSpaces
HHemanth Velury
CEO & Co-FounderMay 12, 2026
Why Photoreal 3D Renders Are Replacing Mood Boards | Interior Design Client Presentations | VirtualSpaces
HHemanth Velury
CEO & Co-Founder
May 08, 2026
From 2D Floor Plans To Living Worlds: The Spec‑Accurate 3D Engine | VirtualSpaces
HHemanth Velury
CEO & Co-Founder
May 06, 2026
Why Furniture Brands Need AI 3D Visualization Now | VirtualSpaces
HHemanth Velury
CEO & Co-Founder
May 4, 2026
How Property Portals Can Turn 2D Floor Plans into 3D Design Decisions | VirtualSpaces
HHemanth Velury
CEO & Co-Founder
April 29, 2026
The Home-Fit Test: Why Square Footage Misleads | VirtualSpaces
HHemanth Velury
CEO & Co-Founder
April 27, 2026
Designing Homes That Sell: 3D Visualization ROI Data | VirtualSpaces
HHemanth Velury
CEO & Co-FounderApril 24, 2026
What's Next: Foursite & Remodroom's New AI Features | VirtualSpaces
HHemanth Velury
CEO & Co-Founder
April 22, 2026
AI in Architecture: Closing the 85% Exposure Gap | VirtualSpaces
HHemanth Velury
CEO & Co-Founder
April 20, 2026
Interior Design Pricing in 2026: From Hourly to Value-Based Fees | VirtualSpaces
HHemanth Velury
CEO & Co-FounderApril 17, 2026
How Foursite and Remodroom Help Designers Win Clients | VirtualSpaces
HHemanth Velury
CEO & Co-Founder
April 15, 2026
Designing Spaces for People: Remodroom + Foursite AI Guide | VirtualSpaces
HHemanth Velury
CEO & Co-Founder
April 13, 2026
Designing for the Way People Actually Live: How AI 3D Is Finally Closing the Gap Between Floor Plan and Reality
HHemanth Velury
CEO & Co-Founder
April 11, 2026
Design in Real Time: AI Renders in Your First Client Meeting
HHemanth Velury
CEO & Co-Founder
April 06, 2026
Why Real Estate Photography Is No Longer Enough: The Shift to Spatial-First Listings
HHemanth Velury
CEO & Co-Founder
April 03, 2026
Property Management's Hidden Weapon: AI 3D Floor Plans That Cut Vacancy Time and Raise Tenant Quality
HHemanth Velury
CEO & Co-Founder
April 01, 2026
Off-Plan and Oversubscribed: How AI 3D Visualization Is Transforming Real Estate Pre-Sales
HHemanth Velury
CEO & Co-Founder
March 30, 2026
Why Foursite Beats Generic AI Tools for Interior Design 3D Visualization
HHemanth Velury
CEO & Co-Founder
March 27, 2026
7 Tenets of Interior Design: How AI Accelerates Harmony in Residential Spaces
HHemanth Velury
CEO & Co-Founder
March 25, 2026
What Is the 3-5-7 Rule in Interior Design? Foursite's AI Guide for Residential Spaces
HHemanth Velury
CEO & Co-Founder
March 23, 2026
What Is the 70/30 Rule in Interior Design? Foursite's AI Guide for Residential Spaces
HHemanth Velury
CEO & Co-Founder
March 20, 2026
How AI 3D Visualization Is Rewriting Residential Interior Design Workflows
HHemanth Velury
CEO & Co-Founder
March 18, 2026
Beyond Marketing: How 3D Floorplans Transform FM, Retrofit Planning & ESG Operations
HHemanth Velury
CEO & Co-Founder
March 16, 2026
Why AI Companies Use Token Payments (And Why VirtualSpaces Is Returning To Fiat)
HHemanth Velury
CEO & Co-Founder
March 13, 2026
Floorplan‑Native Digital Twins: Beyond BIM for Consumer‑Ready Real Estate Experiences
HHemanth Velury
CEO & Co-Founder
March 11, 2026
The Foursite Platform Thesis: Why Floor Plans, Not Photos, Are the Next Property Software Primitive
HHemanth Velury
CEO & Co-Founder
March 09, 2026
Design Systems for Space: Building Reusable 3D Component Libraries on Top of AI Floorplan‑to‑3D Engines
HHemanth Velury
CEO & Co-Founder
March 06, 2026
How to Standardize Design Quality Across Global Projects Using AI Floorplan-to-3D Tools
HHemanth Velury
CEO & Co-Founder
March 04, 2026
From CAD-First to AI-First: Reskilling Your Team for AI-Native Design Workflows
HHemanth Velury
CEO & Co-Founder
March 02, 2026
Algorithmic Ergonomics Meets Photorealistic 3D: Designing Human-Centered Smart Homes with Foursite in 2026
HHemanth Velury
CEO & Co-Founder
February 27, 2026
The Ethics of AI in Interior Design: Ownership, Originality, and Client Transparency
HHemanth Velury
CEO & Co-Founder
February 25, 2026
Designing with Empathy: Using AI 3D Visualization to Improve Client Communication and Emotional Clarity
HHemanth Velury
CEO & Co-Founder
February 23, 2026
From Tool to Infrastructure: AI Floorplan-to-3D and the Next Wave of PropTech
HHemanth Velury
CEO & Co-Founder
February 20, 2026
AI Interior Design for Holiday Homes: Turn Spare Flats into High-Demand Short-Stay Rentals with 3D Visuals
HHemanth Velury
CEO & Co-Founder
February 18, 2026
The Pre‑Purchase Power Play: How Savvy Home Buyers Use 3D Floor Plan Visualization to Negotiate Better Deals
HHemanth Velury
CEO & Co-FounderFebruary 16, 2026
AI Interior Design for Non‑Designers: How Homeowners Can Brief Like Pros
HHemanth Velury
CEO & Co-Founder
February 13, 2026
Scaling a Design Business Without Hiring a 3D Team: An Owner's Guide
HHemanth Velury
CEO & Co-Founder
February 11, 2026
From Bland to Bold: How to Rescue Builder-Grade Interiors on Any Budget
HHemanth Velury
CEO & Co-Founder
February 6, 2026
The Psychology of Space: How Room Dimensions Influence Interior Design Decisions
HHemanth Velury
CEO & Co-Founder
February 4, 2026
The Future of Interior Design Visualization: How AI Technology is Transforming 2D Concepts Into 3D Reality
HHemanth Velury
CEO & Co-Founder
February 2, 2026
AI Interior Décor: How Artificial Intelligence Generates Design Options from Your Floor Plan
HHemanth Velury
CEO & Co-Founder
January 30, 2026
Photoreal vs. Reality: What Clients Actually Expect from Interior Design Visualization
HHemanth Velury
CEO & Co-Founder
January 28, 2026
The Design Approval Conversation That Changes Everything: Communication Strategy When Using Photorealistic Visualization
HHemanth Velury
CEO & Co-Founder
January 25, 2026
Interior Design as Experience Design: How 3D Visualization Changes Your Professional Identity
HHemanth Velury
CEO & Co-Founder
January 23, 2026
The Professional Gap: How 3D Visualization Changes Interior Design Client Perception
HHemanth Velury
CEO & Co-Founder
January 21, 2026
Why Clients Fire Designers (And How 3D Visualization Could Have Saved the Project)
HHemanth Velury
CEO & Co-Founder
January 16, 2026
Blueprint to Vision: Why Seeing Is Believing in Interior Design
HHemanth Velury
CEO & Co-Founder
January 14, 2026
The Speed of Responsiveness: How AI Visualization Tools Make You Look Like You Care More
HHemanth Velury
CEO & Co-Founder
January 12, 2026
Why Interior Designers and Architects Can't Compete Without AI 3D Visualization Tools
HHemanth Velury
CEO & Co-Founder
January 07, 2026
From "Saved" to "Sold": How Homeowners Are Planning Renovations with AI
HHemanth Velury
CEO & Co-Founder
January 05, 2026
The Interior Designer's Secret Weapon: Speed as Premium Positioning
HHemanth Velury
CEO & Co-Founder
December 31, 2025
Gratitude, Growth & Game-Changing Innovation: VirtualSpaces' 2025 Journey & What's Coming in 2026
HHemanth Velury
CEO & Co-Founder
December 29, 2025
Why Interior Designers Are Switching to AI Floor Plan-to-3D Tools in 2026
HHemanth Velury
CEO & Co-Founder
December 26, 2025
AI Virtual Staging for Real Estate Agents: Sell More Homes Faster with Foursite
HHemanth Velury
CEO & Co-Founder
December 24, 2025
Why Architects Are Switching to AI 2D-to-3D: The SketchUp Alternative
HHemanth Velury
CEO & Co-Founder
December 19, 2025
2D Floor Plans Are Dying: Why 3D Visualization & AI Virtual Staging Are the Future
HHemanth Velury
CEO & Co-Founder
December 17, 2025
Virtual Staging vs Physical Staging: How AI Saves Money Per Property
HHemanth Velury
CEO & Co-Founder
December 15, 2025
AI Floor Plan to Image: Revolutionizing Real Estate Marketing for Agents
HHemanth Velury
CEO & Co-Founder
December 12, 2025
Color of the Year 2026: Cloud Dancer | VirtualSpaces AI Interior Design Guide
HHemanth Velury
CEO & Co-Founder
December 10, 2025
AI Floor Plan to 3D: The New Standard for Interior Design Workflows
HHemanth Velury
CEO & Co-Founder
December 08, 2025
How Interior Design Studios Can Operationalize AI 2D-to-3D Workflows (Without Breaking Their Process)
HHemanth Velury
CEO & Co-Founder
December 06, 2025
How to Implement AI Interior Design Workflows in Your Studio
HHemanth Velury
CEO & Co-Founder
December 4, 2025
How Homeowners Can Use AI Interior Design Tools to Plan Renovations with Confidence
HHemanth Velury
CEO & Co-Founder
November 28, 2025
Interior Designers in the Age of AI: From Threat Narrative to Superpower
HHemanth Velury
CEO & Co-Founder
November 21, 2025
Foursite Launch: Embracing 'Release Early, Release Often'
HHemanth Velury
CEO & Co-Founder
November 13, 2025
Foursite by VirtSpaces: Empowering Interior Designers, Architects, and Homeowners
HHemanth Velury
CEO & Co-Founder
November 7, 2025
Reimagining Architectural Education: How AI Floorplan-to-3D Technology Can Transform Design Learning
VVirtualSpaces Research Labs
AI Research Initiative
October 27, 2025
Archisculpt AI: Turning Architectural Drawings into Photorealistic 3D Spaces
AAbhijeet Naik
Co-Founder & CTO
October 13, 2025
Home Makeover: From Floor Plan to Dream Space with AI
HHemanth Velury
CEO & Co-Founder
October 6, 2025
Real-Time Rendering & AI: Revolutionizing Interactive Property Walkthroughs with VirtSpaces
HHemanth Velury
CEO & Co-Founder
September 26, 2025
Foursite - A True AI-Native Experience in Design Visualization
AAbhijeet Naik
CTO & Co-Founder
September 18, 2025
Why PropTech Startups Are Betting on AI Interior Design
HHemanth Velury
CEO & Co-Founder
September 11, 2025
How AI Differs from Traditional 3D Rendering Software
HHemanth Velury
CEO & Co-Founder
September 2, 2025
From Client to Investor: How Nila Spaces and VirtSpaces Are Redefining Proptech with AI
HHemanth Velury
CEO & Co-Founder
August 25, 2025
VirtSpaces From Virtual Reality to AI – Transforming Real Estate Visualization.
HHemanth Velury
CEO & Co-Founder


We help teams collaborate seamlessly and reduce costs. Virtual Spaces offers cutting-edge technology with flexible plans designed to fit modern teams.
Copyright © VirtSpaces Pvt. Ltd. 2025 All Rights Reserved.
CIN: U74999KA2016PTC094921